 1. Advanced NFL Stats weighs in on the evaluating running backs/running games discussion, which I addressed (with assistance from some wonderful comments) here and here. Do read the whole thing, but Brian has, as always, a very interesting take. Drawing on earlier discussion about risky and conservative strategies for underdogs and favorites (see my discussion of the topic here and Brian's here), he asserts:
I want to address an age-old water cooler question that Chris discussed in his post at Smart Football. Consider two RBs, both with identical YPC averages. One however, is a boom and bust guy, like Barry Sanders, and the other is a steady plodder like Jerome Bettis. Which kind of RB would you rather have on your team?
The answer is it depends. Essentially, we have a choice between a high-variance RB and a low-variance RB. When a team is an underdog team, it wants high-variance intermediate outcomes to maximize its chances of winning. And when a team is a favorite, it wants low-variance outcomes. Whether those outcomes occur through play selection, through 4th down doctrine, or through RB style, isn't important. If you're an otherwise below-average team, you'd want the boom and bust style RB. If you're an otherwise above-average team, you'd want the steady plodder. . . .
Further, even if the high-variance RB has a lower average YPC, we'd still want him carrying the ball when we're losing. This is due to the math involved in competing probability distributions.
That's just one aspect of it. He uses a handy chart for the distribution of runs for the various backs...
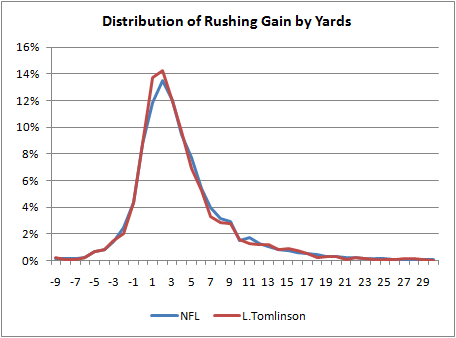
...and notes how curious it is that Tomlinson's distribution looks so much like that of the rest of the NFL. (This same thing ends up holding true for most backs.) What conclusions does Burke draw? With the usual caveats,
[w]hat amazes me is how similar they all are to each other and to the league average. . . . Usually, a RB needs 4 to 5 yards to just break even in terms of his team's probability of converting a first down. What we'd want to see on a RB's distribution is as much probability mass as possible to the right of 4 yards.
So if [Jerome] Bettis' distribution looks so much like Tomlinson's, how does Bettis have a 3.9 career YPC and Tomlinson have a 4.4 career YPC? As others have noted previously, the difference among RB YPC numbers primarily come from big runs. It's the open field breakaway ability that separates the guys with big YPC stats from the other RBs. Of Tomlinson's runs, 1.5% were for 30 yards or more. Bettis' 30+ yd gains comprised only 0.46% of his carries. The other RBs and the league average are as follows:
- NFL 0.91%
- [Jamal] Lewis 0.88%
- [Brian] Westbrook 0.93%
- [Adrian] Peterson 2.20%
Adrian Peterson's 2.2% figure is exceptional. It's interesting because it really suggests that what separates Peterson as a great runner is based on only 2% or so of his runs. Otherwise, he's practically average.
2. Courtesy of Brophy, I have added video of Mike Leach's "settle & noose" drill, which, it will be recalled, is both a great warm-up drill and works on teaching receivers to find holes in the zone and quarterbacks how to deliver the ball to them.
3. Tom Brady muses on life with Bill Belichick. As he tells Details:
"You'll practice on a Wednesday, and you'll come in Thursday morning and he'll have the film up there from practice," Brady says. "Sometimes, during practice, you throw a bad ball—that's the way it goes. But the video comes up and he says, 'Brady, you can't complete a g--damn hitch.' And I'll be sitting there thinking, I'm a [expletive] nine-year veteran, I've won three ---damn Super Bowls — he can kiss my... That's what you're thinking on the inside. But on the outside I'm thinking, You know what? I'm glad he's saying that. I'm glad that's what he's expecting, you know? Because that's what I should be expecting. That's what his style is."
(Ht Shutdown Corner).
4. Bruce Feldman chats with Norm Chow, who materializes into matter from various spectral rays to participate.
5. The NY Times's The Quad Blog chats with Dan Shanoff about, what else, his Tim Teblow blog.
6. Spencer Hall/Orson Swindle to SB Nation. When you get $7 million from Comcast, you better find ways to spend it, and I can't think of a better way than for SBNation (whose official name is "Sportsblogs, Inc.") to lure Every Day Should Be Saturday's Spencer Hall over, including away from the Sporting News. I like everyone else think this is a wise move for both sides, but one underrated aspect is that Mr. Hall/Swindle (Mr. Hall-Swindle? I kind of like that) will be able to focus on just one blog (and probably a book too), which should really let him flourish.
7. Holly over at Dr Saturday remembers Northwestern's magical 1995 season, which is still the only 10 win season in school history. This was a sort of epoch-changing season for NW -- though that is a very relative statement -- in that the Wildcats' history since has been considerably better. Indeed, two years later I saw them play in the Citrus Bowl against Tennessee (this was back in the "You can't spell Citrus without UT" days). Though, most of that game was spent marveling at the show Peyton Manning put on (408 yards, 4 touchdowns, no interceptions) as I sat there telling everyone around me what Peyton Manning's audibles would be (for some reason Northwestern thought it could play man coverage against Tennessee's receivers, so he kept checking to fades and slants). In any event, it is hard to overstate how strange but wonderful that 1995 season was for Northwestern. In football, sometimes the gods are with you.
0 comments:
Post a Comment